Nikkei Research “Brand Perception Index”
- Brand
Visualizing the corporate brand equity.
Unveiling the structure and the story underneath for planning the engagement with your customers.
Nikkei Research has been evaluating the brand equity of corporate brands annually, since 2003. In 2020, the 18th survey collected total of over 90,000 responses from both consumers and businesspersons. 600 corporate brands were selected across 60 industries/sectors by considering their business in Japan; power in the market (share, revenues, etc.) and other activities that have impact to the economy. The whole dataset includes over 200 data points from average of 800 respondents, each brand.
Exclusive preview of the ranking of 600 brands is available at the end of this article.
The story matters.
How did the brand equity establish? What was the journey and what will it look like tomorrow?
It is the approach to people; how you emphasize, how it will stick to them, and how you deepen the relationship. Focusing on the story of the corporate brand, Nikkei Research’s “Brand Perception Index” discovers the strength and weakness of your brand by the structure of the brand value, the customer journey, the timeline trajectory.
Visualizing the brand value.
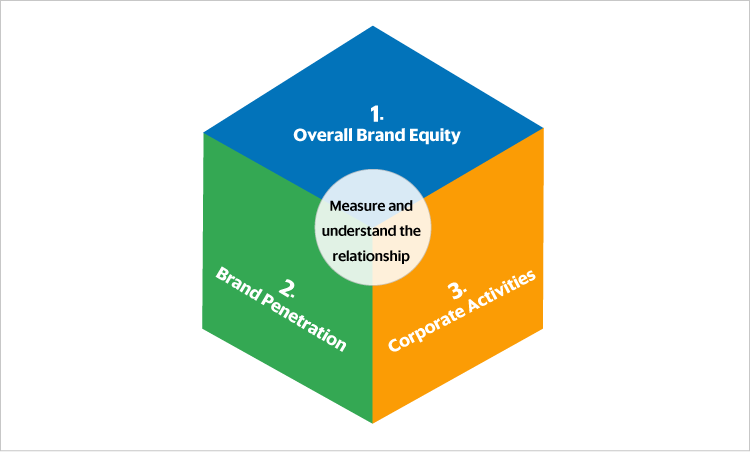
Brand Perception Index composites of 3 core aspects. By a deep-dive to the each items used for the evaluation, you will see the why and how of the brand equity resulted.
This whole framework allows us to compare between brands within the 600 brands data we have, but also by having a custom survey for your brand if not tracked by our index.
Fundamental data for checking, analysis, and problem solving.
 |
 |
 |
|---|---|---|
| Compare with other competitors. Helps you understand the position in the market for an effective strategy planning. ■Is our brand doing better than competitors? ■What is our current status on awareness and the understandings of our service/product? ■What impressions do people have on us? And does it stand out from others? |
Check the progress of the brand’s penetration by looking at the timeline trajectory. A useful data for mid-long term marketing effectiveness evaluation. ■We’ve been aggressively advertising the last 2 years. But has the awareness improved? ■Are there any changes to our perception, recently? ■Has our brand value recovered from 5 years ago, when we had a big defamation? |
Breaking down the data by gender, age group, or other elements. Evaluating the performance of a specific target, or looking at which segment overperformed / underperformed, or to search and find new targets.
■What do our targets of employees in specific industries say about us? ■How should we choose certain segments as our targets? ■We are a conglomerate but do the performance differ by the understandings of our business fields. |
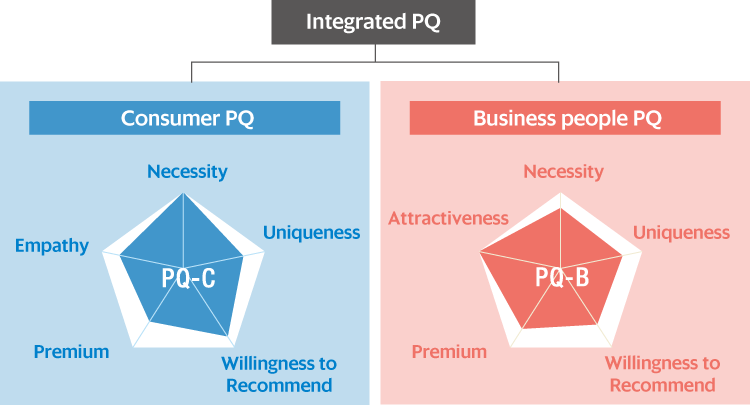
The Perception Quotient(PQ): Evaluating the brand equity
PQ score originally developed by Nikkei Research is the core foundation of the index for the overall brand equity. It shows the comprehensive capabilities of corporate brands.
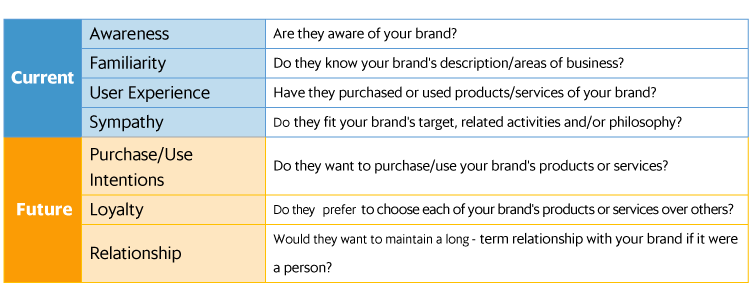
Measurement of Brand Penetration
Brand penetration is the key metric to assessing brand equity. Measurements will be made based on the current status such as awareness and familiarity as well as the future attitude such as purchase/use intentions.
Penetration Funnel
By visualizing the performance of each element, you will find the necessary improvement points intuitively.
Measuring the outcome of your corporate activities
Various corporate activities also cultivate the brand value. We measure the 4 pillars of everyday activity that affects brand value.
The 4 Pillars
 |
 |
 |
 |
|---|---|---|---|
| Assessing the consumers all the point of contact with your brand over the past year. | Probing for key elements that make your brand attractive to consumers. | Impressions from consumers let you develop personas of the brand. | Indentifying the expectations on the event of experiencing your brand. |
| ・Actual Experience ・Event ・Mass Media ・Transit/Outdoor ・Advertisement ・Internet/Social Media ・Word of Mouth |
・Informative Design ・Products/Services ・Customer Services ・nvestment Appeal |
・Confidence ・Customers ・Cool ・Originality ・Adaptability ・Quality ・CSR |
・Stimulus ・Happiness ・Distinctive ・Thought Leadership ・Grabs Attention ・Hight Quality ・Cared |
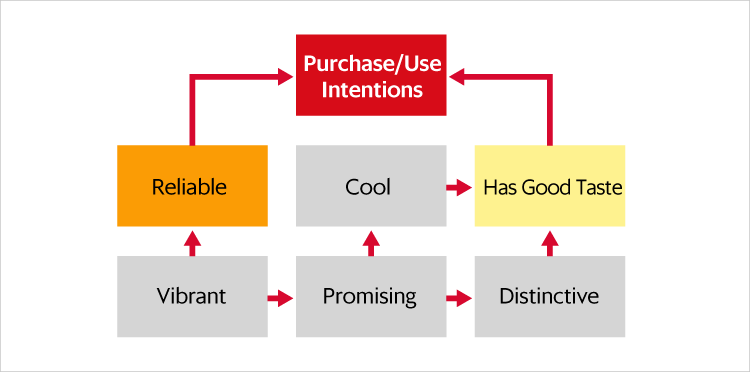
Advanced Analysis
Bayesian network analysis
To grasp what contributes to your KPI and to find images to be reinforced.
Insights will be derived intuitively by visualizing the relationship towards the goal of your branding activities.
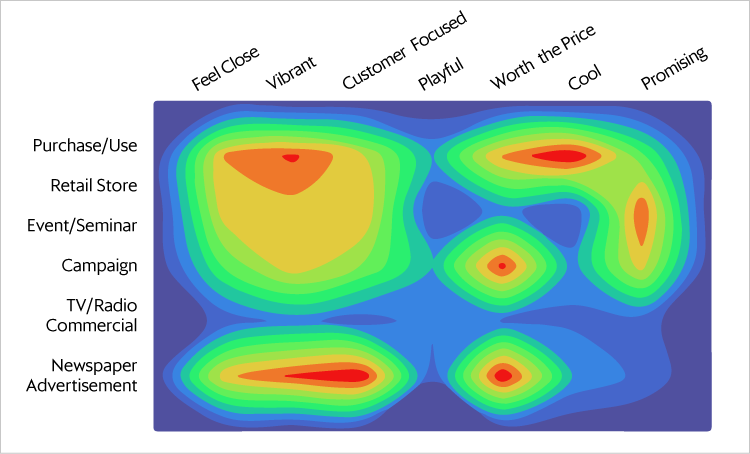
Value Chain Map®
Visualize the connection between activities and the brand image.
Helps you find what made the current brand impressions and where to focus further.
Methodology and the history of the survey
600 corporate brands were chosen across broad industries. The 18th survey was conducted nation-wide in Japan by online through June to July 2020. Answers from total of 47,136 respondents for the consumer group and total of 46,636 respondents for the businessperson group were collected. Averaging 790 respondents for each brand in the consumer group, and 780 respondents for each brand in the businessperson group. The survey is held annually for over 15 years.
-
81-3-5296-5129(Available on weekdays at 10 a.m. to 6 p.m. JST)
- Inquiry